
Leverage diagnostics to keep production running smoothly
Leverage diagnostics to keep production running smoothly
Michelle Weimert
Sr. Manager, Temperature Marketing
Emerson Process Management
The continuing trend to increase production of crude oil from shale deposits in the US and oil sands of Canada has brought new opportunities in production. Production of tight-oil in the US is projected to grow from the current 1.5 million barrels per day (bbl/d) to between 2.8 and 4.2 million bbl/d. As a result, new technical issues have come to the surface as refineries optimize their product mix. Finding solutions is critical before disruptions in production lead to equipment failures, as was the case at multiple refineries in 2011 according to US Department of Energy’s Energy Assurance Daily.
Unplanned shutdowns at hydrocarbon processing plants can cut fuel production by millions of gallons. Therefore, refiners need to utilize all the tools in their toolkit to keep the process running smoothly. One tool, in relation to heat used in the refinement process, is temperature transmitters. Transmitters can be used as a tool to monitor the refining process and provide diagnostic information. The data can identify an issue before it causes process upsets, dangerous conditions, or measurement failure.
Not all transmitters are created equal
The level of diagnostics available on temperature transmitters varies. Most have internal diagnostics that monitor transmitter memory, functionality and output validity. They also offer external diagnostics for monitoring the measurement signal for such things as drift, degradation, measurement validity, and broken or damaged leads among others. Of all transmitters that are available, those with a HART™, FOUNDATION™ fieldbus, or Profibus protocol offer the most sophistication.
These smart temperature transmitters can run real-time diagnostics to ensure accuracy and stable measurements are reported to the control system. While others provide alerts to prioritize maintenance scheduling for more efficient use of available maintenance resources.
Alerts do not affect the transmitter’s ability to output the correct measurement signal and therefore will not interrupt the 4-20 mA output. An example is “Process Variable Out-of-Range”. (See Figure 1) Alarms, on the other hand, will drive the transmitter output either high or low depending on user’s configuration choice. Alerts and alarms can be read on a local indicator, on a field communicator, or on a HART-compliant monitoring system.
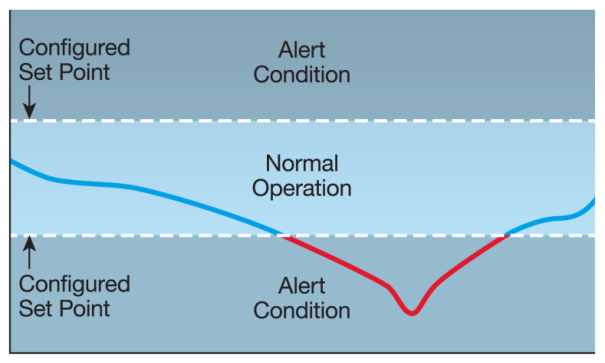
Figure 1
The most popular transmitters are those incorporating HART protocol wherein a large amount of operational and diagnostic data is contained in the digital HART signal that is superimposed on the analog 4 – 20 mA output signal of the transmitter. Any or all of this data may be accessed via:
- · A hand-held field communicator
- · A HART-enabled capability in the DCS I/O systems to extract and monitor the HART data
- · A HART-enabled asset management system
As with the hard wired HART transmitters described above, the information embedded in the HART signal for WirelessHART™ transmitters may be accessed by the same devices
Finding a cause with diagnostic information
Some temperature transmitters offer a diagnostics logging feature that stores advanced diagnostic information between device resets, such as what caused the transmitter to go into an alarm, even if the event has disappeared. For example, if the transmitter detects an open sensor from a loose terminal connection, the transmitter will emit an alarm. The diagnostics logging feature keeps track of what caused the transmitter to go into alarm. The cause can be accessed from the field communicator and/or from an asset management system. (See Figure 2)
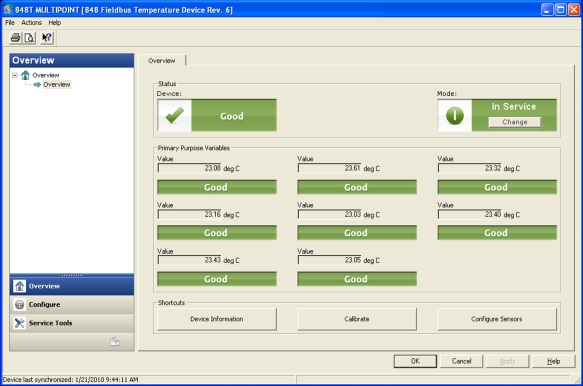 Figure 2
Diagnostics help avoid the biggest issues
The three biggest issues that diagnostics help you to avoid are Measurement Failure, Poor Measurement Reliability, and Suboptimal Process Control.
Measurement failure occurs when any of the components of the system fail. The sensors are relatively delicate and are exposed to the harsh process environment making them more susceptible to failure than the other components. The use of redundancy, drift detection, and monitoring of the measurement instrument’s diagnostics all help to identify and address sensor or instrument degradation or failure.
Poor measurement reliability is the key to minimizing disruptions to the process. The measurement system should be designed to minimize or eliminate the problems caused by sensor degradation, electrically noisy environments or instrument failure so as to ensure a reliable temperature measurement. The design should use such features noise filtering, measurement validation, drifting sensor signal identification, and alerts for broken or loose sensor leads.
Suboptimal Process Control means as it sounds that the process is being kept below standards. The ultimate goal of providing an accurate and reliable measurement signal is to provide process control that reliably keeps the process within pre-determined limits. The diligent use of transmitter and system diagnostic features can identify situations where these limits are violated and identify and quantify the deviations. They can identify intermittent sensor failures, record minimum and maximum process temperatures, and log failures and their causes. Using this information can support rapid response to address identified issues to ensure optimal process control is maintained.
Failure, reliability and control all have their own set of options
There are several approaches that can be used to avoid measurement failure, maximize measurement reliability and optimize process control. For example, measurement failure is often related to sensor failure. This can be monitored with: the Hot Backup® feature; a Sensor Drift Alert; Thermocouple Degradation Diagnostic; and Open/Short Sensor Detection.
Hot Backup® - improvise process availability (See Figure 3)
Sensor Drift Alert – improves measurement accuracy
Thermocouple Degradation Diagnostic - helps prevent unplanned shutdowns
Open/Short Sensor Detection - improves uptime
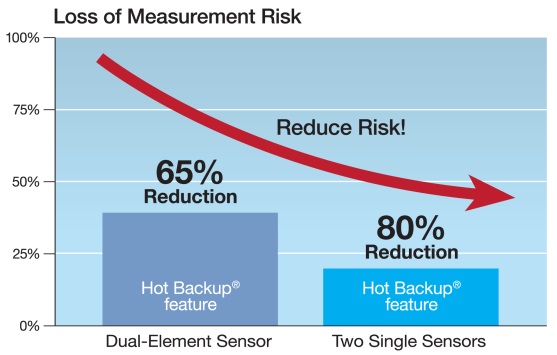 Figure 3
Maximizing measurement reliability can be achieved by: Open Sensor Fold Off; Intermittent Sensor Detection; a Line Voltage Filter; EMF Compensation; and Recall Factory Trim.
Open Sensor Hold Off - identifies the true source of the alert
Intermittent Sensor Detection - avoids unnecessary signal interruption
Line Voltage Filter – maintains measurement accuracy
EMF Compensation – improves RTD measurement accuracy
Recall Factory Trim – makes maintenance easier
Process control can be optimized too with: the Diagnostics Log, Max/Min Tracking, Transmitter/Sensor Matching, Configurable Process Alerts, Ambient Compensation and Measurement Validation.
Diagnostics Log – easier troubleshooting with a history of device alerts and alarms
Max/Min Tracking – improve troubleshooting
Transmitter/Sensor Matching – improves measurement accuracy
Configurable Process Alerts – easier monitoring
Ambient Compensation – improves measurement accuracy
Measurement Validation – improves uptime
Diagnostics save time and money
Judicious use of the diagnostics provides a return on this investment (ROI) in proportion to the criticality of the measurement. The investment is mostly in time spent and the ROI may be measured in increased throughput, higher product quality, less downtime, less product waste, lower energy costs or more subjectively, by the prevention of an explosion.
Diagnostics provide a valuable and useful window into measurement performance... you should keep your window clean.
To learn more about temperature diagnostics, and find answers to other common temperature measurement questions go to www.rosemount.com/TempGuide and order The Engineer’s Guide to Industrial Temperature Measurement. (See Figure 4)
Figure 4


Comments