
EIA: Fuel economy improvements projected to reduce future gasoline use
Gasoline demand is a function of the fuel economy of the vehicle fleet and the total number of miles driven. Over time, fuel economy of the vehicle stock (those in use) changes as a result of market developments and changes in fuel economy standards for new vehicles. Additional complexities arise from changing vehicle designs and how vehicles are classified.
In 2016, total vehicle miles travelled (VMT) reached a record 3.217 T mi (3% growth over 2015), pushing US product supplied for finished motor gasoline, a measure of consumption, to a new high of 9.33 MMbpd. Fuel economy for the light-duty vehicle stock in 2016 is estimated at 22.2 mi/gal, an increase of 1% over 2015.
The fuel economy of the vehicle fleet reflects the number of vehicles in use by vintage, as well as the respective fuel economy and the number of miles driven for each vintage. While the average fuel economy of the stock changes only modestly based on sales of new light-duty vehicles in a single year, trends in new vehicle sales and the consequent fuel economy cumulatively have large implications for projected future gasoline consumption. The increase in the sales share of light trucks—a category that includes pickups, minivans, sport-utility vehicles (SUVs), and all other light-duty vehicles that are not classified as passenger cars—in total light-duty vehicle sales, is sometimes cited as a cause of recent growth in fuel consumption. More important for long-term gasoline consumption, however, are the scheduled increases for fuel economy standards covering model years through 2025 and the increasing market role of vehicles that blur the distinction between cars and light trucks.
In recent years, manufacturers have introduced new vehicle types that combine the capabilities of pickup trucks and truck-based SUVs—cargo space, towing capacity, all-wheel or four-wheel drive capability, seating height—with those of cars—comfort, handling, and higher fuel economy. As a result, there has been an increase in the number of models and total sales of vehicles described as crossovers or Crossover Utility Vehicles (CUVs). CUVs have similar appearance, seating height, and cargo space as SUVs, as well as optional all-wheel drive, but have comfort and handling more similar to passenger cars. These CUVs are built like modern passenger cars (unibody construction rather than body-on-frame), and they often use the same small, efficient engines as passenger cars. The share of the total light-duty vehicle market (under 10,000 lbs gross vehicle weight) attributed to CUVs rose to 32% in 2016 according to Wards Automotive, an automotive analysis group. The rise of CUVs in the marketplace is causing the relationship between vehicle capabilities and vehicle fuel economy to become more complex.
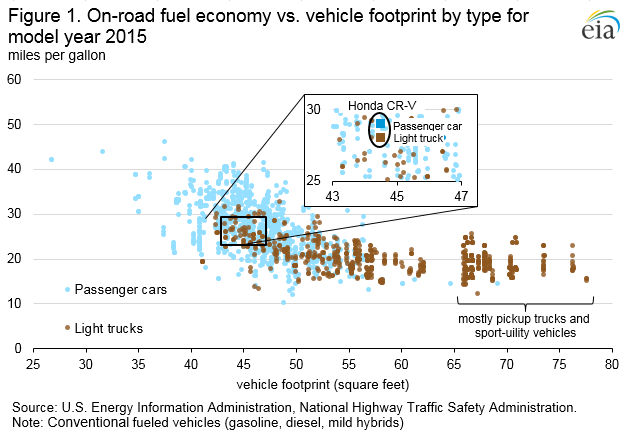
Comparisons of on-road fuel economy versus vehicle footprint (a measure of overall vehicle size) shows many models of light trucks are CUV models according to the National Highway Traffic Safety Administration (NHTSA) and the Environmental Protection Agency (EPA) that have similar fuel economies and sizes as passenger cars (Figure 1). The light trucks with larger vehicle footprints and lower fuel economy tend to be pick-up trucks, such as the Ford F-150, or SUVs, such as the Chevrolet Tahoe. All else equal, the growing share of CUVs tends to raise the sales-weighted average fuel economy of the vehicles classified as light trucks.
It is also important to recognize that there are multiple ways to classify CUVs. The Bureau of Economic Analysis (BEA), a source for calendar year vehicle sales, and some industry sources classify vehicles on the basis of gross vehicle weights limits, vehicle appearance, and other criteria. In BEA's data, all CUVs are counted as light trucks.
For purposes of implementing fuel economy standards, however, EPA and NHTSA count some CUVs as passenger cars and regulates by model year, a methodology adopted by EIA. One of the bestselling CUV models, the Honda CR-V, qualifies as either as either a light truck (all-wheel drive version) or a passenger car (two-wheel drive version), with an on-road fuel economy difference between the two classifications of only one mile per gallon (Figure 1). Other popular models with the same mixed classification include the Toyota RAV4, Nissan Rogue, and Ford Escape. In these examples, the differentiating factor is whether the vehicle has front-wheel drive or the optional all-wheel drive. Some other CUVs and vehicle model types may also be classified as passenger cars by NHTSA depending on other criteria.
Passenger cars and light trucks based on NHTSA's classifications are subject to separate footprint-based fuel economy standards, with the standards for light trucks generally less stringent than those for passenger cars. That given, a focus on BEA or other calendar year sales data for the light truck market share tends to overstate the extent of how less stringent light truck standards are applied to overall sales of light-duty vehicles, and the consequent fuel economy of the new vehicle fleet. For model year 2015 (the latest data available), sales of light trucks as a percentage of total light-duty vehicle sales was 43% using EPA data, compared with the BEA's reported 57% share for calendar year 2015 (Figure 2). For calendar year 2016, BEA data show light trucks increased to 61% of the 17.5 million light-duty vehicles that were sold in the United States, the highest share in published data going back to 1976. The EPA-based light truck sales share for model year 2016 is not yet available, but is also likely to exceed the comparable 2015 value potentially without as large of an increase as seen in the BEA data.


Comments