


Digital Exclusive: Rotating equipment failure cases with abnormal vibration frequencies and levels
K. W. BRASHLER, S. H. DOSSARY, D. C. TURCAN, W. A. ALHARBI and A. N. GHAZAL, Saudi Aramco, Dhahran, Saudi Arabia
This article demonstrates the significance of casing vibration analysis in diagnosing three instances where excessive vibration levels were observed, and the dominant frequency in the spectra did not correspond to any known forcing frequency.
What makes these cases similar is that casing vibration analysis, along with other supporting tests, was instrumental in reaching a conclusion. This approach saved valuable time and resources while helping to avoid potential further internal damage.
Case 1: High compressor casing vibration level with 0.9x dominant frequency. A particular gas compressor is part of a compression train with a rated capacity of approximately 1 Bft3d. FIG. 1 illustrates the machine train and the layout of its vibration sensors. The compression train consists of a turning gear (1), a gas turbine driver (2), a low-pressure (LP) compressor (3), a high-pressure (HP) compressor (4), a clutch (5) and a starting motor (6).
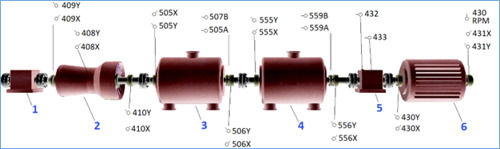
FIG. 1. Gas compression train arrangement.
The technical information of the gas compressor is the following:
- Total capacity: 1 Bft3d
- Gas turbine driver: 75,000 kW
- Suction pressure: 250 psig
- Discharge pressure: 1,000 psig.
The compressor train was manually shut down after an extremely loud noise was heard, accompanied by violent shaking of the compressor area, a high differential pressure (Δp) on the HP compressor balance line and elevated clutch casing vibration.
Initially, the investigation plan included inspecting the clutch (to verify engagement and disengagement, which was found to be in proper working condition), the outboard coupling and the suction strainer, as well as conducting a compressor borescope and balance line check.
All these checks did not reveal any noticeable issues. As a result, it was decided to conduct an additional run test, with the objective of collecting high-quality condition data from the compressor, particularly vibration data, including compressor casing vibration, to help identify the source and cause of the vibration.
The HP compressor was restarted and, after 3.5 hrs, an increase in the balance line Δp was observed. The vibration sensors detected this change (FIG. 2), but the vibration levels remained well within allowable limits, and no abnormal frequencies were present at that time.
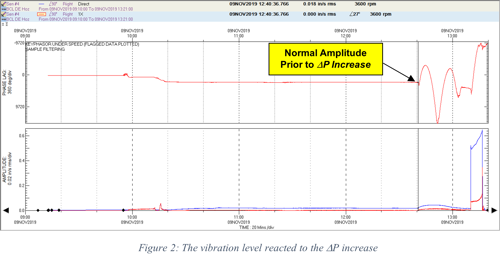
FIG. 2. The vibration level reacted to the Δp increase.
Approximately 30 min later, the vibration levels sharply increased to around 0.5 in./sec. root mean square (RMS) (FIG. 3) from just 0.018 in./sec. RMS. Note: The compressor weighs 176,000 kg.
The fact that the phenomenon described above occurred with a significant time delay following startup suggests that it may be related to thermal expansion. It could potentially be caused by an abnormal internal temperature rise, leading to an opening or crack within the system.
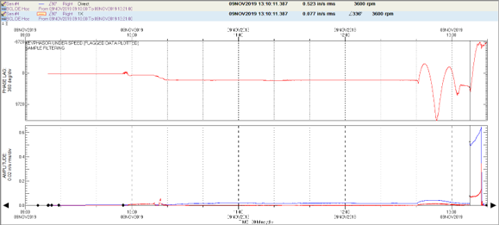
FIG. 3. Vibration sudden increases above 0.5 in./sec. RMS at 13.10 on 11/9/19.
It is worth noting that the same behavior was observed in the shaft relative vibration (FIG. 4). However, since the vibration levels did not reach the alarm threshold, this was not considered a critical issue for compressor operation.
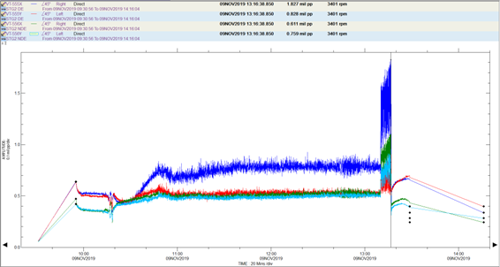
FIG. 4. Sudden increase in shaft relative vibration. This vibration occurred simultaneously with the casing vibration increase.
The vibration data indicated the appearance of a subsynchronous frequency near 0.9x at the time of the sudden vibration increase (FIG. 5). This frequency is typically associated with flow-induced vibration, possibly due to stall conditions. This subsynchronous frequency was recorded in the range of 0.88x–0.91x rotational speed. This variation was noted as part of the observed behavior.
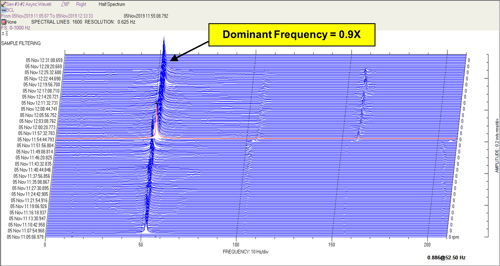
FIG. 5. 0.9x sub-synchronous flow-induced vibration on the compressor casing.
The Bode plot collected during the shutdown of the HP compressor bearing casing indicated the presence of a natural frequency at 51.6 Hz (3,096 rpm), corresponding to 0.86x. It is therefore possible that the potential flow-induced vibration excited this structural natural frequency (FIG. 6).
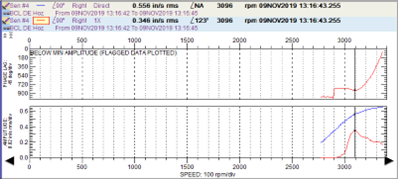
FIG. 6. HP compressor’s drive-end bearing casing’s Bode plot indicating a possible natural frequency of 51.6 Hz (3,096 rpm).
Noise analysis was also performed using a sound camera, which provided further confirmation that the noise source was located on the HP compressor’s discharge side (FIG. 7).
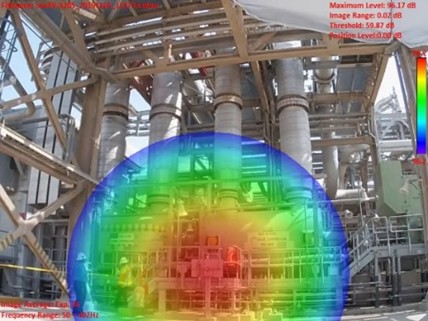
FIG. 7. Main sound source of HP compressor detected at its inboard (maximum of 96.17 dB)
The HP compressor performance analysis revealed a notable deterioration in efficiency over a short period which was considered abnormal. This decline was indicative of potential issues with internal flow dynamics, such as stall or recirculation. For instance, the compressor’s polytropic efficiency initially decreased gradually by 8% during the first set of tests. In the subsequent tests, the efficiency dropped further by 4.5% before the unit was shut down. The abnormalities observed did not correspond to typical compressor failure modes, necessitating the use of advanced diagnostic methods, including casing vibration analysis, as illustrated in FIG. 6. The increase in vibration amplitude, combined with a noticeable shift in phase angle, provided clear evidence of resonance.
Although additional analytical techniques were employed to confirm the root cause of the vibration, the casing vibration analysis played a pivotal role in guiding the investigation. It provided the necessary confidence to proceed with shutting down and dismantling the compressor for further detailed inspection.
Case 2: High pump casing and shaft vibration level with 1.3x dominant frequency. The subject pump is a between-bearing, single-stage, double-suction, radially-split design, as shown in FIG. 8. The pump is rated for 19,500 gpm and a total dynamic head of 1,077 ft. The pump’s driver power rating is 6,700 hp, and a rated speed of 3,580 rpm.
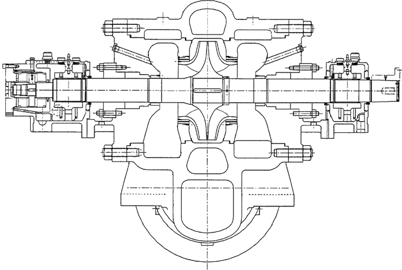
FIG. 8. A cross-sectional drawing of the pump.
FIG. 9 illustrates the machine train, along with the corresponding vibration sensor layout.
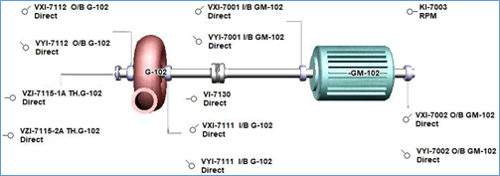
FIG. 9. Pump train arrangement.
In this example, elevated vibration amplitudes were observed in both the casing and shaft vibration measurements. Following a normal startup, the pump’s casing vibration rapidly increased to 0.7 in./sec. peak, with a dominant vibration frequency at 1.3x (FIGS. 10 and 11).
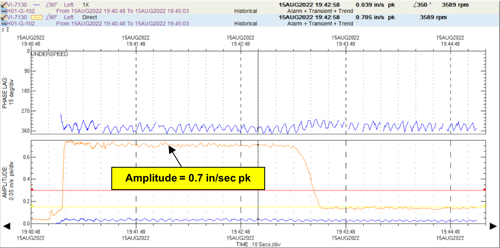
FIG. 10. Pump casing’s vibration trend, which reached a peak of 0.7 in./sec.
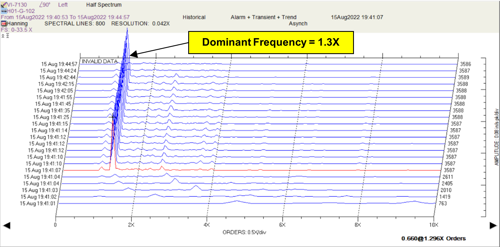
FIG. 11. Pump casing’s vibration showing that the 1.3x dominant frequency level reached approximately 0.66 in./sec.
The pump’s shaft vibration also increased immediately to 10.4 mils peak-to-peak (pp), with a dominant vibration frequency at 1.3x (FIGS. 12 and 13).
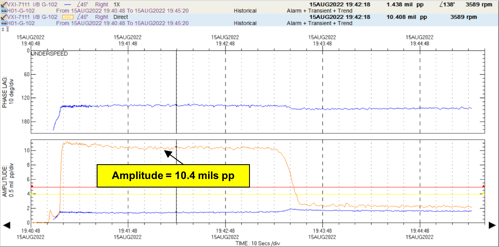
FIG. 12. Pump shaft’s vibration trend showing vibration reaching approximately 10.4 mil pp.
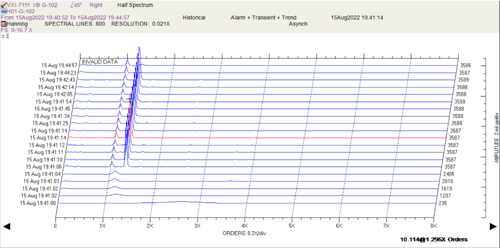
FIG. 13. Pump shaft’s vibration showing the 1.3x dominant frequency level reached approximately 10.1 mil pp.
As a consequence, operating the pump under these conditions was not possible, as the vibration amplitudes exceeded the predefined vibration trip limits. Additionally, operations reported that the pump was producing an abnormal sound. FIGS. 14 and 15 show previously collected vibration data from the casing and shaft that was recorded when the machine exhibited normal vibration behavior.
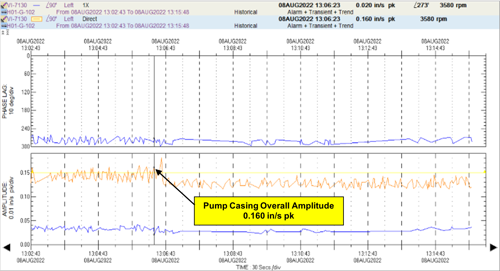
FIG. 14. Pump casing’s vibration prior to failure.
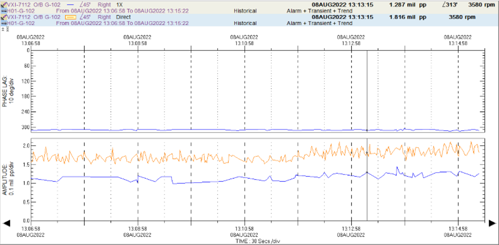
FIG. 15. Pump shaft’s vibration prior to failure.
A review of the process data was conducted to assess whether off-design operation and/or hydraulic degradation contributed to the elevated non-synchronous vibration observed at 1.3x running speed. The hydraulic performance evaluation indicated that the pump was operating within the preferred operating range, ruling out off-design conditions as the cause of the high vibration levels at 1.3x. However, the review did reveal a significant head deterioration of approximately 20%. Such a reduction in head is typically indicative of increased internal clearances due to wear, which may involve components such as wear rings, throttle bushings or other areas of the pump, including the casing or impeller.
More importantly, this performance degradation can lead to internal recirculation, especially in this large single-stage double suction design. This internal recirculation can generate white noise and excite natural frequencies. Due to the double suction configuration, the recirculation can be highly random and uneven between the two sides of the impeller, creating other uneven forces on the rotor. These uneven forces may lead to rotor instability or centralization issues, which, in turn, can cause hydraulic performance problems, as well as internal rubbing due to rotor shift or changes in the rotor's axial position.
Considering all the above, it can be concluded that the increase in vibration amplitude and the dominant frequency of 1.3x is consistent with internal recirculation and the resulting flow-induced excitation. Given the apparent head deterioration, it is suspected that internal running clearances have increased or that other wear or damage, such as across wear rings, throttle bushings or holed impellers, is allowing recirculation from high-pressure to low-pressure zones.
The non-synchronous 1.3x frequency experienced on the pump’s rotor and on its casing can be potentially produced by a flow induced internal resonance. The resonance is one of the few logical explanations for experiencing such a high casing vibration on this massive pump casing.
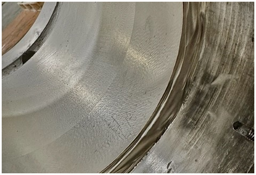
The following were the main findings that were revealed during the pump’s mechanical repair shop dismantling:
- A flow cut was seen on both stuffing box busing areas (16A and 16B)
- There was rubbing on both impeller wear rings and case wear rings (16C)
- There was rubbing on both throat bushings’ inner diameter (ID) and journal bearings’ ID (16D)
- There was rubbing on the shaft (bushing areas, O-ring areas of the mechanical seal and seal areas) (16E)
- There was damage to the discharge face (16F).
(A) 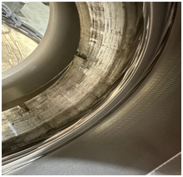
(B) 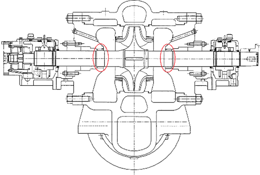 (C)
(C) 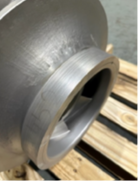
(D) 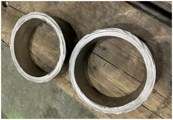 (E)
(E) 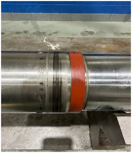
(F) 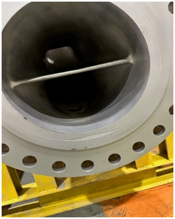
FIG. 16. Discoveries during the pump’s mechanical repair shop dismantling: (A, B) flow cut was seen on both stuffing box busing areas, (C) rubbing on both impeller wear rings and case wear rings, (D) rubbing on both throat bushings, (E) rubbing on the seal area and (F) damage to the discharge face.
Case 3: Vertical pump’s high vibration with 0.5x frequency component. This case involved a two-stage vertical pump driven by a 900-hp electric motor operating at 1,180 rpm. The pump was used for seawater cooling. The pump had been in continuous operation for > 10 yrs without major maintenance or overhaul. It is monitored through an offline vibration condition monitoring program.
The motor is equipped with anti-friction bearings, while the pump features bushings. In April 2024, water leakage was detected from the stuffing box side, and it was replaced in May 2024. The leaked water contained solid particles suspected to be brass material.
Following the replacement, elevated vibration levels were observed on both the drive-end (DE) and non-DE (NDE) of the motor. Vibration analysis revealed a dominant frequency of approximately 0.5x (~9.94 Hz) at all measurement points, with the highest amplitudes recorded in the axial direction. The vibration levels fluctuated, with a tendency to increase over time (FIG. 17).
Despite this abnormal vibration behavior, the pump was tested at various flowrates and was able to reach its rated flowrate at the best efficiency point (BEP) without encountering any major operational issues.
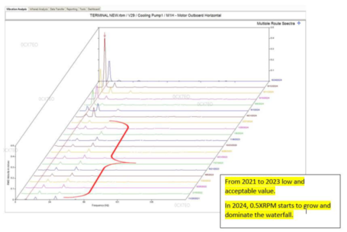
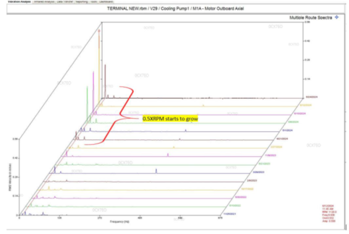
FIG. 17. Motor outboard waterfall showing an increase of 0.5x component in the radial and axial direction during coupled condition with the pump.
Field checks were conducted to investigate the vibration issue, and no major problems were identified. The motor was tested in solo mode, revealing vibration levels (0.5x not being present), which suggested the motor was not the main cause (FIG. 18). All bolts, including anchor and hold-down bolts, were re-tightened to ensure secure mounting. The alignment and leveling of both the pump and motor were verified. Additionally, a cross-phase bolt check confirmed that the bolts were in phase, indicating proper tightening and no significant mechanical issues.
These field checks helped to rule out several potential causes of the vibration issue and confirmed that the pump and motor were properly installed and aligned.
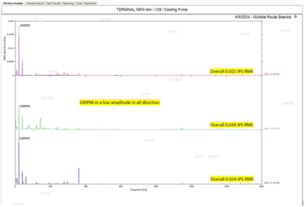
FIG. 18. Motor vibration readings during uncoupled tests.
Based on the vibration data and field findings, a detailed internal inspection of the pump was recommended to assess potential wear or damage, particularly in areas such as the bushings and stuffing box, that could be contributing to the observed vibration behavior.
Upon overhaul, the following conditions were identified during inspection:
- Both the side case and impeller wear rings were completely damaged
- Shaft bushings and impeller areas showed significant erosion and damage
- All bearings exhibited excessive clearance and rubbing marks
- The tension plate, tension nut, spider, pipes and shaft coupling were seized
- The pump head base plate was severely eroded
- Register fit areas, including the pump head, base plate, columns, bowls and suction bell, were either eroded or damaged.
The extent of the damage was more severe than initially anticipated, as illustrated in FIG. 19, which shows the condition of the impeller.
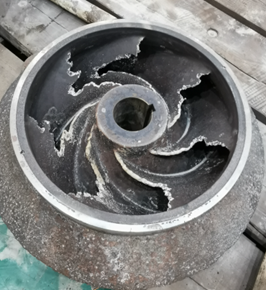
FIG. 19. Impeller condition after dismantling during the repair process.
Following the completion of repairs, the pump was returned to service. The previously observed intermittent high vibrations have since disappeared (FIG. 20). The pump is now operating within acceptable vibration limits, with no abnormal conditions detected.
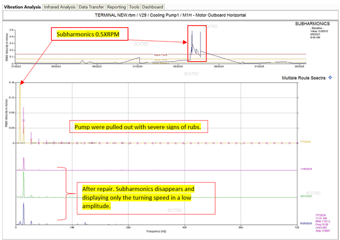
FIG. 20. Motor vibration readings before and after repair showing the elimination of the 0.5x component.
Takeaways. The presented case studies demonstrated the effectiveness of casing vibration measurements, particularly in situations where vibration behavior is ambiguous. Although casing vibration instrumentation is typically omitted for most large rotating equipment equipped with hydrodynamic bearings and shaft probes, it proved to be a critical factor in diagnosing and resolving the issues described in these cases.
In the first case, casing vibration analysis identified a resonance phenomenon and pinpointed the frequency of interest. Additional tools such as finite element analysis and computational fluid dynamics provided supporting insights, linking the resonance to O-ring failure.
In the second case, large shaft and casing amplitude observed at 1.3x, along with the significant head deterioration, were consistent with internal damage and flow recirculation.
In the third case, intermittent vibrations occurring at 0.5x, which increased over time, indicated damaged bushings. Upon inspection, the pump was found to be in much worse condition than initially anticipated.
The main takeaway from these cases is that casing vibration measurements can be highly valuable in diagnosing certain failure modes, particularly in larger machines, where casing vibration amplitudes are typically low and often not considered a primary parameter for condition monitoring. While it may be difficult to diagnose certain failure modes, such as rotor imbalance or bearing wear, using casing vibration alone, these case studies illustrate that casing vibration data can significantly aid in identifying and understanding machine health issues.
Ideally, a baseline should also be established for casing vibration measurements on large rotating equipment. This baseline should be captured under normal operating conditions when the machine is new or has been recently overhauled. By doing so, users can effectively monitor trends and observe changes in vibration signatures over time. A significant change in amplitude or the appearance of an abnormal frequency component can then serve as an early indicator of a potential change in machine condition, warranting further investigation.



Comments