EIA - US crude oil imports rise during first-half 2016
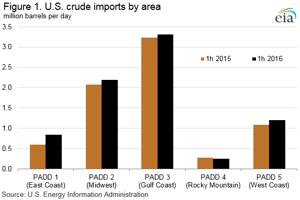
During the first half of 2016, US gross crude oil imports increased by 528 Mbpd, or 7%, compared to the first half of 2015. This increase reverses a multiyear trend of decreasing US crude oil imports as a result of increasing US production. East Coast crude oil imports, which are reported as imports to Petroleum Administration for Defense District (PADD) 1, were up the most, rising by 244 Mbpd (41%) compared with the first half of 2015. Crude imports increased in all other regions except the Rocky Mountain region.
On a national basis, shipments from Nigeria, Iraq, and Canada contributed most to increased imports. Imports from Nigeria, Iraq, and other members of the Organization of the Petroleum Exporting Countries (OPEC) rose by 504 Mbpd. Declining imports from Mexico, which fell 118 Mbpd, more than offset the increase in imports from Canada, limiting the overall increase of non-OPEC imports to less than 24 Mbpd.
Changes in crude oil price spreads, which may have been influenced by the lifting of US export restrictions on crude oil in December 2015 as well as logistical factors discussed below, were a significant factor in the rise of US imports during the first half of 2016. The narrowing differences between certain US crudes and international benchmarks provided an incentive for increased imports by refiners in areas where imported crudes now had a delivered cost advantage relative to domestic crudes of comparable quality. Additionally, lower overall crude prices contributed to a decline in US crude production from an average of 9.5 MMbpd in the first half of 2015 to 9.0 MMbpd in the first half of 2016, resulting in higher net crude oil imports.
Another factor affecting US crude imports is a continued shift in crude oil logistics. The North Dakota Pipeline Authority reports that pipelines continued displacing rail in transporting Bakken crude, rising from a market share of roughly 35% at the beginning of 2015 to nearly 57% by June 2016, with rail inversely declining from roughly 60% to about 30%. Unlike crude by rail movements, which primarily transport Bakken crude to the East and West Coasts, pipelines primarily transport Bakken crude to refineries in the Midwest and Gulf Coast. Pipeline transportation is significantly less expensive than rail. As a result, logistical constraints and costs that had previously depressed wellhead crude prices were alleviated, reducing downward price pressure that had previously made Bakken crude especially attractive for certain refiners, particularly on the East Coast. This then shifted flows of Bakken crude oil to refineries in PADD 2 and PADD 3, where refineries in both regions continued to run at near-record rates for much of the first-half of 2016 contributing to increased product exports. In contrast to Bakken, competing light-sweet African barrels are taking advantage of an oil tanker glut that has pushed shipping rates near all-time lows, improving their price competiveness. In addition to falling domestic production and a relative decline in the competitiveness of midcontinent crude, US refinery demand rose by 133 Mbpd, creating further opportunities for imports.
As a result of shifting price, supply, and logistical dynamics, East Coast (PADD 1) crude imports rose by 244 Mbpd (41%), nearly three-quarters of which were supplied by Nigeria. Nigerian production actually declined during the first half of 2016 due to elevated supply disruptions. However, falling US production and increasing competitiveness for seaborne light sweet crudes into the East Coast more than offset lower production levels, enabling imports from Nigeria to displace crude received from the Midwest (PADD 2), which declined by half, or 200 Mbpd. As a result, imports from Nigeria—which had fallen from more than 1 MMbpd in 2010 to only 7,000 bpd during the first half of 2015—were able to partially return to their former primary market in the East Coast, rising to 186 Mbpd during the first half of 2016.
In the Midwest, crude imports rose by 104 Mbpd (5%) during the first half of 2016 compared with the same time last year. Canada accounted for almost all of the increase despite wildfires in Alberta that disrupted production later in Q2. Canada is the largest source of crude oil imported into the US and its heavy crude is particularly well suited for US refiners in the Midwest and Gulf Coast.
Gulf Coast (PADD 3) imports increased 88 Mbpd (3%), with rising imports from Middle East and African countries offsetting declines from Latin America. Imports from Iraq increased by 142 Mbpd, more than the next four countries combined. Iraq’s production in 2015 rose by 700 Mbpd, enabling more of their production to be exported to the US.
The Rocky Mountain (PADD 4) is the only region with declining imports during the first half of 2016, with volumes down by 24 Mbpd (9%). PADD 4 is relatively isolated from import infrastructure compared with other regions and imports have been entirely sourced from Canada for more than a decade, a trend that continued during the first half of 2016.
Imports to the West Coast (PADD 5) rose by 116 Mbpd (11%). Saudi Arabia, Canada, and Ecuador are the top three sources of PADD 5 crude imports, accounting for about two—thirds of crude oil imports into the region and about 86% of the region’s import growth during the first half of 2016.


Comments