
Industrial AI for guided diagnosis of KPI deviations in production operations
Industrial AI for guided diagnosis of KPI deviations in production operations
P. TAYAL, Honeywell Forge Principal Data Scientist; S. WOODARD, Product Marketing Manager
The need for advanced data analytics in industrial applications has been amplified as global dynamics and regulatory requirements have placed more demand on operators to perform to meet the needs of the market, while managing fundamental changes in workforce attrition, performance across aging assets, and complex and disparate data systems. Industrial operators have a clear need to do more, faster, with a shrinking skilled workforce while also maintaining safe, reliable, and profitable operations.
This convergence of needs has created an opportunity for Artificial Intelligence (AI) to be applied in new ways to controls and MES software systems and enable operators to leverage their own data to generate meaningful and actionable insights to optimize performance. This trend has placed even greater importance on corporate digital transformation programs that look across operations to digitize traditionally manual processes and implement new software that standardizes and centralizes data.
While companies struggle with variability in operations, tight budgets, and lack of a complete and accurate view from data across their operations, research has found that companies can have up to approximately 70%[1] of their data go unused and while production interruptions and inefficiencies can be costly, data scientists can spend up to 80%[2] of their time preparing data before providing insight back to the business, leading to delays in critical production operations decisions and lost time and productivity. For a manufacturing plant that must triage production issues daily, common data and analytics problems include:
- Production teams often spend less time optimizing unit performance and lose time on nonvalue add activities such as cleansing, manually transforming, or organizing data & data transformation.
- Many operators have multiple siloed systems such as historians, alarm management, controls, and asset monitoring systems all generating different types of data residing on different network levels with no or poor integration between these systems, leading to missing perspectives.
- Data relationships & context remain elusive making it challenging to identify the root cause of failures and leverage that data to predict and prevent future problems.
- Lack of standardized metrics often leads to misalignment in business goals from the enterprise down to site operations and makes it difficult to extract actionable insights from data.
- Inability to scale analytics where systems deployed for single units and sites cannot be implemented at scale to provide consistent operation management and performance.
With Industrial AI, a variety of methodologies are used to extract insights from the data generated by manufacturing processes, and Honeywell’s approach has been to leverage it as a tool to improve or develop software that will help companies overcome these challenges for better business outcomes.
Here we will explore the AI-enabled guided diagnostics and decision capabilities germane to Honeywell Forge software and specifically for industrial production operations, we will look at the use of Industrial AI techniques that help identify the potential contributors for KPI deviations in production performance. Our methodology takes into consideration the performance management KPIs that are continuously monitored, other KPIs in case of roll-ups, the assets upstream & downstream relationships and the associated tags to help identify the possible causes of a specific KPI deviation.
Industrial AI modeling techniques
Fundamentally, artificial intelligence is the science and engineering of using “computers and machines to mimic the problem solving and decision-making capabilities of the human mind” [3]. Subsets of artificial intelligence include the well-known “machine learning” and “deep learning” modeling techniques, and in 2023, the concept of “generative AI” came to the forefront and has presented new ways of making humans more effective and efficient in their work.
Machine learning focuses on using data and algorithms from physical assets to identify patterns, trends, correlations and ultimately simulate human-like learning capabilities to understand current and future potential behaviors. Within machine learning, supervised and unsupervised learning algorithms are used. Supervised learning is trained using labeled datasets and unsupervised learning uses techniques to analyze unlabeled data such as clustering, in which data are grouped based on similarities or differences; association, a methodology used to find relationships; and dimensionality reduction, a learning technique that reduces the number of variables in a dataset. Fundamentally, within supervised learning, the algorithm can use the dataset to train itself to make predictions, where unsupervised learning algorithms are applied to learn a data’s structure and naturally occurring patterns without guidance.
Deep learning evolves machine learning further by being able to analyze large amounts of unstructured data using multi-layered neural networks to simulate human learning and make intelligent decisions with minimal assistance. Deep learning can recognize complex patterns in data sources such as pictures, text, and sounds. Generative AI, as a subset of deep learning, can create new content including images, music, videos, and text such as conversations and stories, based on the data it was trained on.
Further, additional new advances in machine learning, such as causal AI, which draws on supporting data, such as relationships, dependencies, and other context, such as operational events, is a modeling technique that learns the cause and effect of those relationships to support identifying the root cause in any dataset.
Honeywell employs several of these techniques in our software, and for KPI deviation management in production operations, Honeywell has the capability to apply Industrial AI algorithms to production events when they occur to understand why the events have happened and to identify the potential contributors.
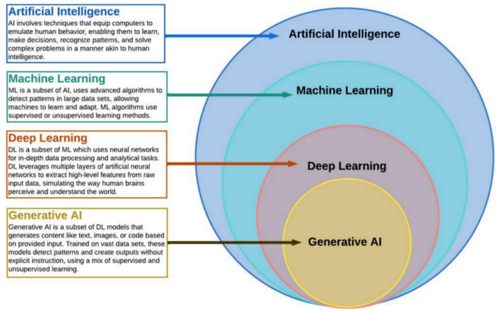
Image Source: Popova Zhuhadar, L. A. 2023. Unraveling AI Complexity - Comparative View of AI, Machine Learning, Deep Learning, and Generative AI.
Industrial AI for KPI deviation management
Key Performance Indicators (KPIs) ensure the smooth and efficient operation of the refinery plant, as they allow engineers to track and monitor the performance of various processes and equipment within the plant. By closely monitoring these KPIs, we can identify any areas of poor performance and potential for improvement.
In the chemical or refinery industry, there are many KPIs critical to the plant's overall success. These can include measures of energy consumption, production rates, and product quality, among others. Each of these KPIs is dependent on various process variables, which can number in the thousands. It is complex to understand these dependencies and how they impact the overall performance of the plant.
When deviations in KPIs occur, it is important to quickly identify the root cause to take corrective action. However, with so many process variables and their complex dependencies, this can be a time-consuming and challenging task. Spending hours troubleshooting these issues takes away valuable time from other important tasks and could result in significant losses for the company.
Furthermore, the dynamic nature of production processes means that deviations in KPIs can occur randomly and may not follow traditional failure patterns. This makes it even more difficult to identify the root cause and take timely action. Failure to address these issues promptly could result in significant financial losses for the company.
By understanding the strongest cause-and-effect relationships between process signals and KPIs, industries can develop actions to improve performance and prevent future deviations. This not only helps to ensure the smooth and efficient operation of the plant, but also contributes to the overall success of the company.
Guided diagnosis
With the large volume of data generated by our plant's instruments, it can be challenging to identify the root cause of any deviations in our KPIs. This is where guided diagnosis comes in. By utilizing Machine-learning (ML) and Causal AI techniques and integrating them into a Decision Support Tool (DST), we can effectively diagnose KPI deviations. This tool not only considers the KPI and other process variables for the specific unit or asset under consideration, but also includes upstream and downstream variables with feedback loops.
To make this process even more efficient and accurate, we utilize a Knowledge Graph structure. This structure acts as a common language that defines the entire end-to-end process flow, dependencies, and maps contextualized information from various disparate data sources. By incorporating this contextualized information, we can gain a more comprehensive understanding of the factors that may be contributing to KPI deviations.
Overall, guided diagnosis is a powerful tool as it allows engineers to make more informed and data-driven decisions, ultimately improving the overall performance of our operations.
Guided diagnosis methodology
We integrate diversified Machine Learning (ML) and Causal Inferencing techniques, like Supervised, Unsupervised, and Potential outcomes, and exploit the advantages of these methods to accurately diagnose the KPI deviation. The proposed approach works in a multi-agent’s diagnosis framework.
Once we have identified potential contributors using these techniques, we use Knowledge Graphs to further analyze the data. Knowledge Graphs represent data in a visual format, with nodes representing entities and edges representing relationships between them. By analyzing the topological relations and proximity (lags) between different nodes, we can further refine our understanding of the potential contributors and their impact on KPI deviations.
Finally, we use this information to rank the potential contributors. This multi-agent diagnosis framework allows us to effectively diagnose KPI deviations and take proactive measures to promote smooth and efficient operations in the refinery plant.
The solution is designed to keep ‘At scale’ in mind. The business problem is to diagnose large number of KPIs deviation across various customers with different requirements. Using typical research-oriented ML model creation approach is not sustainable. It is difficult to build hundreds of different ML models to address many KPIs and their behaviors. Not only is it difficult to train and build hundreds of ML models but also it is difficult to benchmark and maintain them, as data will be continuously shifting in the real world. The proposed solution uses ‘Algorithmic Agents’ that act as detectives and become active when the KPI deviation occurs. This approach is very effective working with changing data and behavior.
The proposed solution of guided diagnosis offers a flexible and systematic approach to addressing KPI deviations. This means that instead of relying solely on the algorithm to automatically identify contributors to the deviation, the engineers can also manually select them if needed. This adds an element of human expertise and input, which can be valuable in certain situations.
By allowing for manual inputs, the solution can adapt and improve over time as it learns from these inputs. This means that in the short to medium term, the accuracy of the guided diagnosis will continuously improve. As a result, we can expect to see a higher percentage of acceptance from our customers, indicating that the solution is effective in identifying and addressing KPI deviations.
REFERENCES
[1] Microsoft 365 Team. (2019, Oct 08). The benefits of business analytics. Microsoft. https://www.microsoft.com/en-us/microsoft-365/business-insights-ideas/resources/benefits-of-business-analytics
[2] Pragmatic Editorial Team. Overcoming the 80/20 Rule in Data Science. Pragmatic Institute. https://www.pragmaticinstitute.com/resources/articles/data/overcoming-the-80-20-rule-in-data-science/
[3] Vazquez, C. and Goodwin, M. (2020, Feb 20). What is artificial intelligence (AI) in business? IBM. https://www.ibm.com/topics/artificial-intelligence-business


Comments